Scrum Burn Down Charts: संपूर्ण गाइड 2026
 Scrum Burn Down Charts - संपूर्ण गाइड
Burndown chart, जिसे burn down chart भी कहा जाता है, शेष कार्य बनाम समय का एक graphical representation है।
इसे commonly Agile project management और Scrum methodologies में project, sprint, या iteration की progress track करने के लिए use किया जाता है।
त्वरित उत्तर: Burn Down Chart एक नज़र में
| पहलू | विवरण |
|---|---|
| क्या दिखाता है | Sprint में remaining work vs. available time |
| X-Axis | समय (Sprint के days) |
| Y-Axis | Remaining work (story points, hours, या tasks) |
| Ideal Line | Sprint की शुरुआत से end तक perfect burndown |
| Healthy Pattern | Real line ideal line के पास या नीचे |
| Burn-Up से अंतर | Burn-Down remaining work दिखाता है; Burn-Up completed work दिखाता है |
विषय सूची-
- Burn Down Chart क्या है?
- Burn Down Charts कैसे काम करते हैं
- 6 Burndown Patterns और उनका अर्थ
- अपना Burndown Chart बनाना
- Burn Down Charts को Effectively Use करना
- Burndown Charts में Common Mistakes
- Burn Up vs. Burn Down Charts
- Burndown Charts की Limitations
- निष्कर्ष
- Scrum Burn Down Charts पर Quiz
- Frequently Asked Questions
Burn Down Chart क्या है?
 Burn Down Chart क्या है?
Burndown Chart एक visual representation है जो tasks की progress track करती है, चाहे वह epic के भीतर हो या sprint के भीतर।
यह showcase करती है कि कितना work complete हो गया है और कितना work बाकी है।
इसका significance aesthetics से beyond है; यह आपकी team की journey के लिए एक predictive compass है, allocated time के भीतर tasks complete करने की likelihood gauge करती है।
Agile projects के realm में, Burndown Charts दो main flavors में आती हैं:
Product Burndown Charts
Product Burndown Charts पूरे project का holistic view प्रदान करती हैं।
- Horizontal axis sprint numbers represent करता है
- Vertical axis story points display करता है
- Release planning और stakeholder communication के लिए useful
Sprint Burndown Charts
Sprint Burndown Charts ongoing sprints पर focus करती हैं।
- Horizontal axis Sprint के days represent करता है
- Vertical axis Sprint Backlog में remaining work represent करता है
- Development Team द्वारा daily update की जाती है
- हर Daily Scrum में review होती है
Scrum Guide Burn Down Charts को mandatory artifacts के रूप में require नहीं करता, लेकिन ये widely adopted transparency tool हैं। Goal visibility है, control नहीं।
Burn Down Charts कैसे काम करते हैं
Burn Down Chart में typically दो axes होते हैं:
- Horizontal Axis: Sprint में available time represent करता है, usually days में divided।
- Vertical Axis: Sprint में remaining work की amount represent करता है, usually effort units में measured, जैसे Story Points या task hours।
जैसे-जैसे Development Team Sprint के भीतर tasks complete करती है, remaining work decrease होता है, और Burn Down Chart downward trend दिखाता है।
Chart कैसे पढ़ें:
- Real line ideal line के नीचे: team ahead है
- Real line ideal line के ऊपर: team behind है
- Real line flat: कोई work complete नहीं हो रहा (potential blocker)
- Real line ऊपर जाती है: Sprint में work add हुई (scope creep)
6 Burndown Patterns और उनका अर्थ
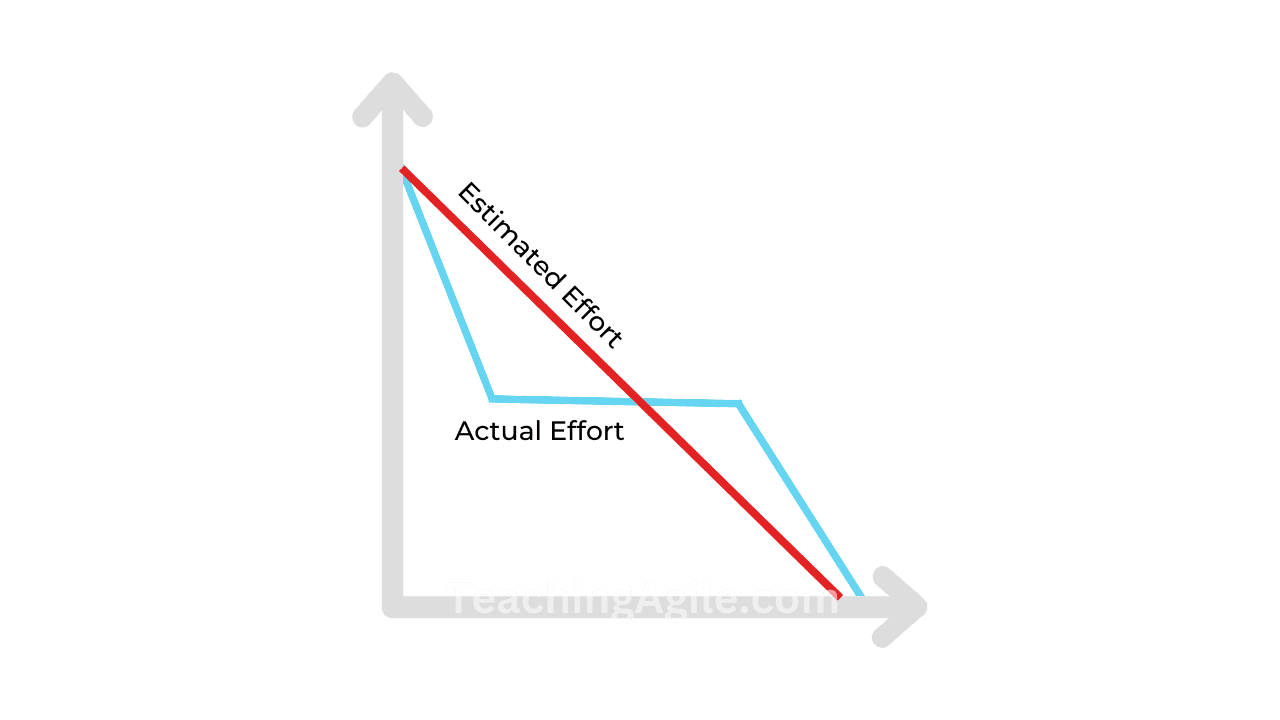 Burn Down Chart में Actual vs Estimated
Pattern 1: Ideal Burndown (Healthy)
Real line ideal line के करीब follow करती है। Team consistently work complete कर रही है।
Pattern 2: Cliff at the End (Risk)
Line Sprint के अधिकांश समय flat रहती है, फिर अंत में dramatically गिरती है। Team batch में काम कर रही है।
Pattern 3: Flat Line (Blocker)
Line कई दिनों तक नीचे नहीं जाती। Team blocked है। Daily Scrum में immediate attention चाहिए।
Pattern 4: Upward Slope (Scope Creep)
Line नीचे जाने की बजाय ऊपर जाती है। Sprint में नया work add हो गया है। Product Owner के साथ discuss करें।
Pattern 5: Early Completion
Line Sprint end से पहले zero पर पहुंच जाती है। Team ने सभी committed work complete कर लिया। Product Backlog से अगला item लाएं।
Pattern 6: Sawtooth (Inconsistent Estimation)
Line erratically ऊपर-नीचे होती है। Inconsistent estimations या sprint के दौरान scope changes।
अपना Burndown Chart बनाना
Step 1: Total Points Calculate करें Sprint Planning के दौरान committed सभी story points sum करें। यह Y-axis पर starting point है।
Step 2: Ideal Line Set करें Day 0 पर total points से Sprint के last day पर zero तक straight line draw करें।
Step 3: Daily Progress Track करें हर day, completed stories के story points subtract करें (जो Definition of Done meet करती हैं)।
Step 4: Real Line Plot करें Daily data points को connect करके team की actual progress show करें।
Step 5: Daily Scrum में Review करें Daily Scrum में updated chart use करें - deviations identify करें और actions discuss करें।
⚠️
केवल वे stories जो Definition of Done completely meet करती हैं, burndown में count होती हैं। "90% done" work burn नहीं होता - यह ensure करता है कि chart truly finished work reflect करे।
Burn Down Charts को Effectively Use करना
अपनी Scrum Team की performance track करने के लिए Burn Down Charts effectively use करने के लिए, इन best practices को follow करें:
-
Chart Regularly Update करें: Ensure करें कि Development Team Burn Down Chart को daily update करती है।
-
Progress Communicate करें: Burn Down Chart को entire Scrum Team और relevant stakeholders के साथ share करें।
-
Issues और Risks Identify करें: Potential issues, risks, या delays identify करने के लिए Burn Down Chart use करें।
-
Adapt और Adjust करें: यदि Burn Down Chart indicate करती है कि team Sprint Goal achieve करने के लिए track पर नहीं है, तो approach adapt करें।
-
Review और Learn करें: प्रत्येक Sprint के बाद, improvement के areas identify करने के लिए Burn Down Chart review करें।
Burndown Charts में Common Mistakes
Mistake 1: Sprint End में ही Update करना
Problem: Team burndown chart को daily नहीं, केवल Sprint end में update करती है।
क्यों हानिकारक: Sprint के दौरान problems detect करने का मूल्य खो जाता है।
Solution: Daily Scrum से पहले हर team member अपना remaining work update करे।
Mistake 2: Incomplete Stories का Partial Credit
Problem: Team "80% done" stories के points count करती है।
क्यों हानिकारक: False progress की image बनती है। Sprint end में unexpected backlog appear होता है।
Solution: All-or-nothing rule। Story Definition of Done completely fulfill करे तभी points count होंगे।
Mistake 3: Team Pressure के लिए Burndown Use करना
Problem: Management burndown को individual team members को supervise करने के लिए use करती है।
क्यों हानिकारक: Team chart को "good looking" बनाने के लिए manipulate करना शुरू करती है।
Solution: Burndown team का है, team के लिए। Transparency इसका core value है।
Mistake 4: Recurring Patterns को Ignore करना
Problem: Same problematic pattern (cliff at end, flat lines) हर Sprint में दिखता है लेकिन address नहीं होता।
क्यों हानिकारक: Systematic problems unresolved रहती हैं।
Solution: Last 3 Sprints के burndown charts को Sprint Retrospective में bring करें।
Mistake 5: Scope Creep को Handle न करना
Problem: Sprint के दौरान नया work add होता है बिना existing work remove किए।
क्यों हानिकारक: Burndown chart ऊपर जाती है, team demoralized होती है।
Solution: नया urgent work हो तो equivalent amount existing Sprint work remove करें।
Mistake 6: Stories बहुत Large होना
Problem: Stories बहुत बड़ी हैं (13+ points) और दिनों तक complete नहीं होतीं।
क्यों हानिकारक: Burndown flat रहती है, progress invisible लगती है।
Solution: Stories को small items में break करें (ideally 1-5 points) ताकि daily progress visible हो।
Burn Up vs. Burn Down Charts
जबकि Burndown Charts agile project management में staple हैं, इनके counterpart - Burn Up Charts को भी mention करना essential है।
 Burn-Up Chart क्या है?
| पहलू | Burn-Down | Burn-Up |
|---|---|---|
| Direction | Total से zero की ओर descend | Zero से total की ओर ascend |
| क्या दिखाता है | Remaining work | Completed work |
| Scope Creep | देखना मुश्किल | Gap के रूप में clearly visible |
| सबसे अच्छा | Daily Sprint tracking | Stakeholders को progress communicate |
Burndown Charts की Limitations
जबकि burndown charts valuable हैं, इनकी limitations भी हैं:
- Quality नहीं दिखाती: Perfect burndown hidden significant technical debt हो सकता है।
- Manipulate हो सकती है: Pressure में teams inflate estimations करती हैं।
- Flow नहीं दिखाती: Process में कहां work accumulate होता है नहीं दिखाती (इसके लिए Cumulative Flow Diagram use करें)।
- Estimation पर depend करती है: Ideal line accuracy initial estimations की quality पर depend करती है।
निष्कर्ष
Burn Down Charts Scrum arsenal में powerful transparency tool हैं, लेकिन इनका value इस बात पर depend करता है कि इन्हें कैसे use किया जाता है।
Key takeaways:
- Daily update करें और Daily Scrum में deviations discuss करें
- केवल Definition of Done completely fulfill करने वाली stories count करें
- Patterns recognize करना सीखें (cliff, flat line, scope creep)
- Burndown को team tool की तरह treat करें, management control tool की तरह नहीं
- Complete picture के लिए Velocity और CFDs के साथ complement करें
प्रश्नोत्तरी: Scrum Burn Down Charts
आपका स्कोर: 0/15
प्रश्न: Scrum में Burn Down Chart का primary purpose क्या है?
और पढ़ें
Sprint Velocity: Agile में संपूर्ण गाइड 2026जानें कि Sprint Velocity Burn Down Charts को complement करके team की progress और capacity का complete picture कैसे देती है।
Cumulative Flow Diagrams: Scrum में CFDजानें कि CFDs Burn Down Charts का flow-based alternative कैसे offer करती हैं bottlenecks identify करने और predictability improve करने के लिए।
Sprint Planning: Scrum Execution की गाइडSprint Planning master करें ताकि accurate estimates और realistic Sprint Goal के साथ Burn Down Chart का starting point set हो।
Sprint Retrospective: Team Performance Boost करेंPast Sprints के Burn Down patterns को data की तरह use करें more focused और effective retrospective conversations के लिए।
Definition of Done: संपूर्ण गाइडसमझें कि केवल Definition of Done meet करने वाला work ही Sprint chart में burn down क्यों होना चाहिए।
Daily Scrum: Effective Daily Standups की गाइडजानें कि Daily Scrum Burn Down Chart review करने और ideal line से deviations discuss करने का सही time है।
Sprint Backlog: Scrum Teams के लिए Essential GuideExplore करें कि Sprint Backlog determine करता है कि हर Sprint के दौरान Burn Down Chart पर क्या track होता है।
Continuous Integration - Scrum Development Boost करेंजानें कि CI/CD practices कैसे Burn Down updates automate कर सकती हैं जब code deploy और test होता है।
अक्सर पूछे जाने वाले प्रश्न (FAQs)
Burn Down Charts और Gantt Charts में agile project management के लिए क्या अंतर है?
क्या Burn Down Chart non-technical projects जैसे marketing या HR में use हो सकती है?
Scrum Master को क्या करना चाहिए जब Burn Down Chart consistently दिखाए कि team हर Sprint में over-commit करती है?
Part-time team members Burn Down Chart interpretation को कैसे affect करते हैं?
Burn Down Chart और Velocity के बीच क्या relationship है?
Modern teams में Burn Down Charts automatically generate करने वाले digital tools कौन से हैं?
Remote teams Burn Down Charts कैसे manage और use करें?
क्या Burn Down Chart manipulate हो सकती है, और इसे कैसे prevent करें?
User Stories का size Burn Down Chart की utility को कैसे influence करता है?
Organizations effective Burn Down Charts implement करने पर क्या ROI expect कर सकती हैं?
Product Owner को Burn Down Chart के साथ कैसे involve होना चाहिए?
Continuous Delivery practice करने वाले teams के लिए Burn Down Chart कैसे adapt होती है?
Non-technical leaders Burn Down Charts को deep technical knowledge के बिना कैसे interpret करें?
Scrum के Sprint Goal के साथ Burn Down Chart का क्या relationship है?
Long project में process changes justify करने के लिए Burn Down Chart कैसे use होती है?